
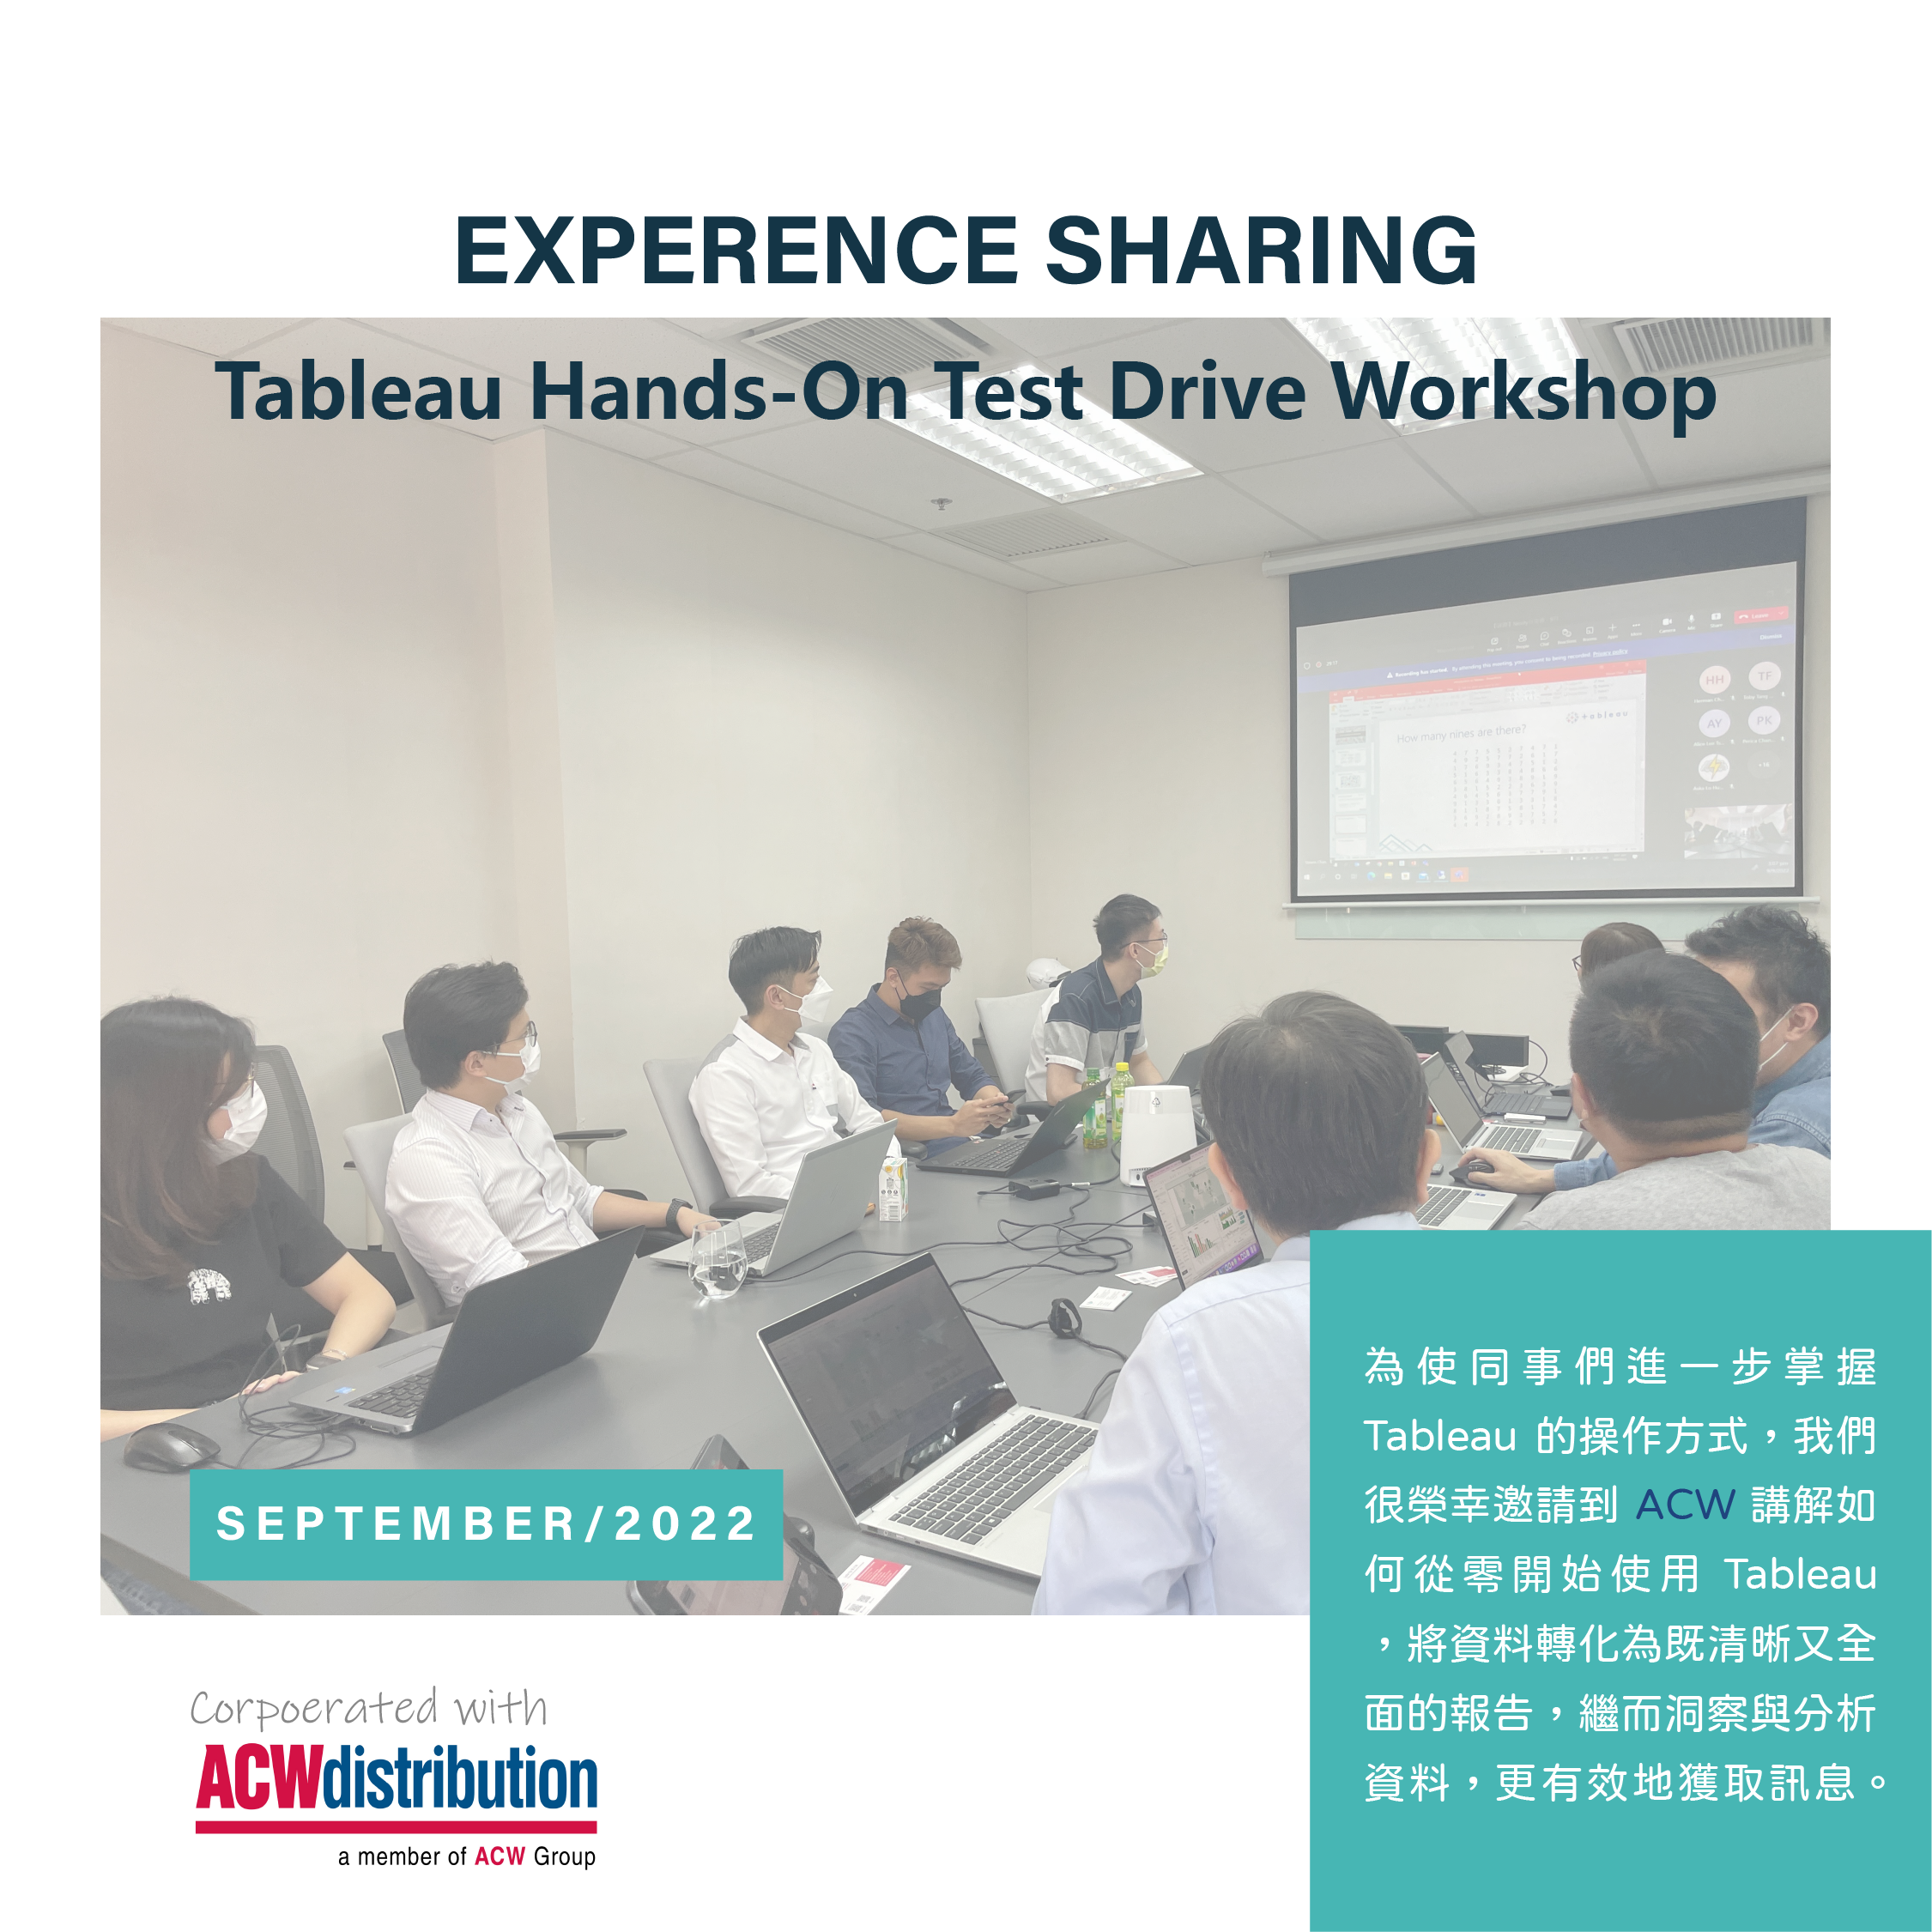

增值自己,從掌握商業智慧技術開始
繼早前Tableau Software與我們分享其強大平台的實用性後,為使同事們可進一步掌握Tableau的操作方式,我們今期分享會很榮幸邀請到友好伙伴ACW Distributor,手把手教導我們從零開始創建互動儀表板,並藉著Tableau多種功能,將原本雜亂無章的資料按不同需求,轉化為既清晰又全面的視覺化圖像,例如地圖、時間序列和趨勢圖等,進一步探索、洞察與分析數據,有助得出關鍵訊息,以便為商業決策提供參考。
Mastering the Business Intelligence Technology for Self-Enhancement
After Tableau Software shared with us the power of their platform earlier, we are happy to have our partner ACW Distributor to teach our colleagues to further master the operation of Tableau to create interactive dashboards from scratch. With Tableau’s functions and features, unorganized data can be visualized and turned into clear and comprehensive presentations such as maps, time series and trend charts, etc. according to different needs for further exploration, gaining insight and analysis, thus helping to obtain key information as references for business decisions.